회사에서 데이터 분석툴로 앰플리튜드(amplitude)를 쓴다.
그런데 이 툴의 비용이 매우 비싸서 이번에 믹스패널(mix panel)로 바꿀지를 고려하고 있는데,
이 참에 비교를 해보면 좋을 것 같아서 비교를 해봤다.
Segmentation View
- 기본 Segmentation 그래프는 큰 차이가 없다.
- 원래 쓰던 앰플리튜드가 익숙하긴 했지만, 그렇다고 믹스패널이 보기 별로이지도 않다.
- 하나 차이가 있다면, 앰플리튜드는 average, median값을 보여줬는데, 믹스패널은 average만 보여준다.


Segmentation View에서의 Group by
- 앰플리튜드는 segmentation View에서 Group by를 해서 데이터를 구분해서 볼 수 있다.
- 비슷한 개념으로, 믹스패널에서도 break down이라는 기능이 group by와 같은 기능으로 보인다.


Funnel View
- 앰플리튜드의 경우 funnel 데이터를 볼 때 holding constant라는 개념이 있다. 이 개념이 뭐지?
- 그리고 하단의 표에서 숫자들이 뭔가 직관적으로 느껴지지 않았다.

- 믹스패널이 funnel 그래프가 뭔가 시각적으로 더 흥미로운 느낌을 주는 것 같은 느낌을 받았고,
- 하단의 단계별 전환율도 훨씬 시각적으로 눈에 들어왔다.
- 그런데 holding constant라는 개념이 없어서 이 부분이 궁금해졌다.

holding constant는 특정 데이터를 모든 funnel이 포함하고 있는 전환만을 본다고 한다.
https://amplitude.com/blog/holding-constant
Conversion Funnel and Holding Constant - Adam Greco
Learn how the holding constant feature in Amplitude can show conversion data that other digital analytics platforms cannot!
amplitude.com
But in our original question, we wanted to see the overall conversion rate for all products but only see the cases in which all three funnel steps were for the same product. While this may sound easy, it isn’t. Most digital analytics platforms cannot do this. Of course, you can build a separate conversion funnel for each product like the one for product 96 above, but that isn’t feasible if you have many products and it still doesn’t answer the question. The digital analytics platform must review all conversion funnel steps and only count cases in which the same product is present in all three steps but perform that conversion calculation for all products simultaneously. In Amplitude, you do this using the holding constant feature.
그러나 본래의 질문으로 돌아와 우리는 모든 제품의 전체 전환율을 보고 싶었지만 세 가지 유입경로 단계가 모두 동일한 제품에 대한 경우만 볼 수 있습니다 . 이것이 쉽게 들릴지 모르지만 그렇지 않습니다. 대부분의 디지털 분석 플랫폼은 이를 수행할 수 없습니다. 물론 위의 제품 96에 대한 것과 같이 각 제품에 대해 별도의 전환 퍼널을 구축할 수 있지만 제품이 많고 여전히 질문에 답하지 않는 경우에는 실현 가능하지 않습니다. 디지털 분석 플랫폼은 모든 전환 퍼널 단계를 검토하고 세 단계 모두에 동일한 제품이 있지만 모든 제품에 대해 전환 계산을 동시에 수행하는 경우만 계산해야 합니다. 앰플리튜드에서는 holding constant 기능을 사용하여 이 작업을 수행합니다.
To use the holding constant feature, you specify the property that you want to hold constant within the report settings area. In this case, you would specify the Item property as shown here:
holding constant 기능 을 사용하려면 보고서 설정 영역 내에서 일정하게 유지하려는 속성을 지정합니다.
이 경우 다음과 같이 Item 속성을 지정합니다.
With that minor change, Amplitude will filter all conversion funnel events to ensure they are all related to the same item/product, and the conversion funnel would recalculate to show this:
이러한 사소한 변경으로 Amplitude는 모든 전환 유입 경로 이벤트를 필터링하여 모두 동일한 항목/제품과 관련이 있는지 확인하고 전환 유입 경로는 다음을 표시하도록 다시 계산됩니다.
Now you can see that the overall conversion rate from View Item Details to Complete Purchase when it is the same product is 2.42%. This significant conversion drop indicates that visitors view and add many different products to the cart but are much less likely to bring one product through all three conversion steps. While performing this type of analysis in Amplitude is easy, I can assure you that it is virtually impossible with other digital analytics platforms. I am amazed that Amplitude can so easily do something so powerful!
이제 동일한 상품일 때 상품 상세보기에서 구매완료까지의 전체 전환율이 2.42%임을 알 수 있습니다.
이러한 상당한 전환 감소는 방문자가 다양한 제품을 보고 장바구니에 추가하지만 세 가지 전환 단계를 모두 거쳐 하나의 제품을 가져올 가능성이 훨씬 낮다는 것을 나타냅니다.
Amplitude에서 이러한 유형의 분석을 수행하는 것은 쉽지만 다른 디지털 분석 플랫폼에서는 거의 불가능합니다.
Amplitude가 그렇게 강력한 작업을 쉽게 수행할 수 있다는 사실에 놀랐습니다!
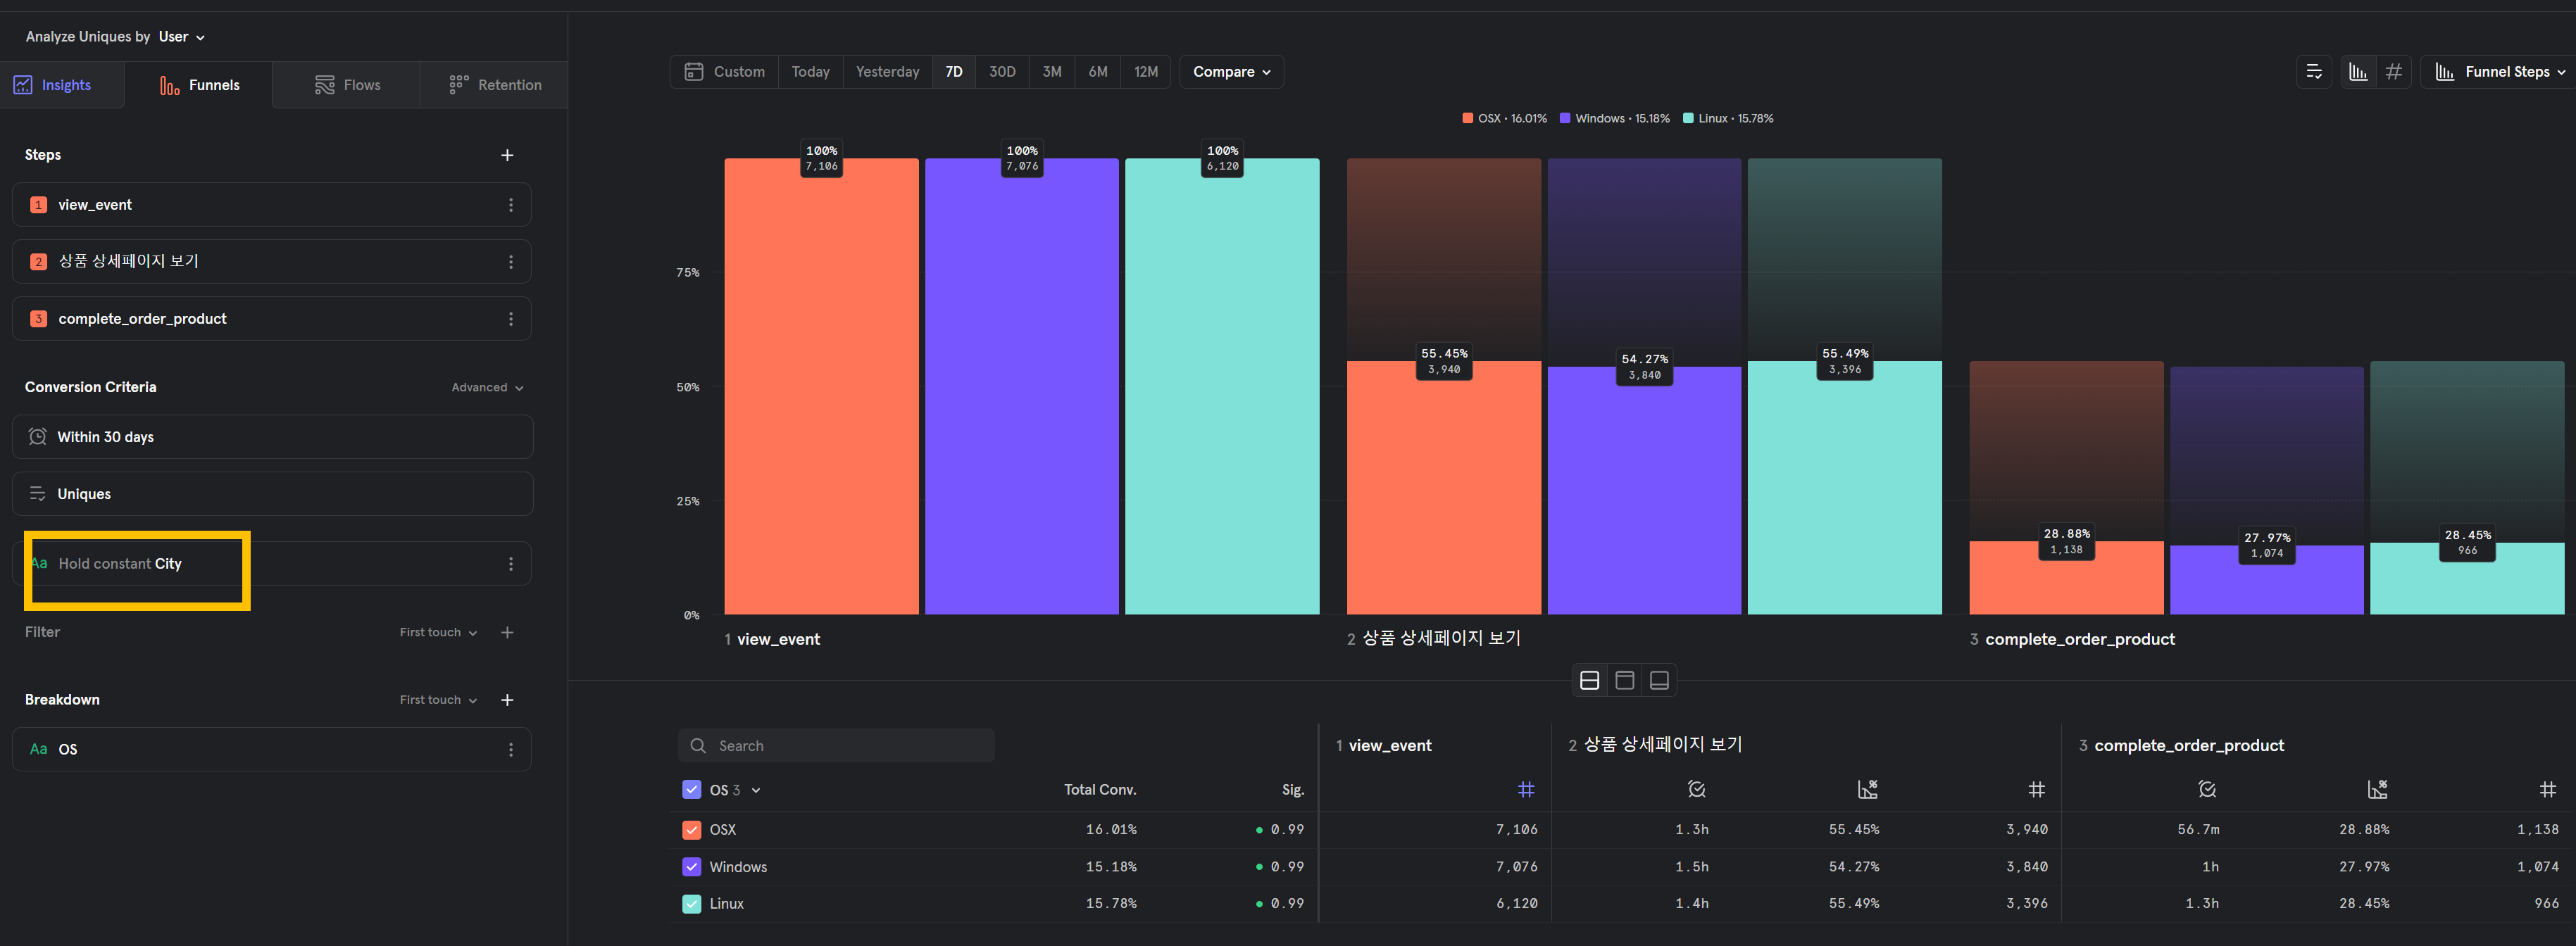
없는줄 알았는데.. 믹스패넏도 holding constant 제공한다.
다른게 없네.. 경쟁은 사용자를 즐겁게 한다..
댓글